

Most people get stuck when it comes to "what's next?". You've already chosen your keywords, did your on-site optimization and some conversion rate optimization but you feel like you need a new vibe to get things back on the road? Looking for a grow path?
This post will get you started (& can be re-used for several years if you wish).
First things first, what's the idea? The idea is to segment the searches your site visitors used, break them down by intent and time of year, and then fold that data back into your site/keyword strategy.
Search Intent
Visitors have the different intents when visiting a site. In a broad sense these can be divided into three categories:
- Navigational intent
- Informational intent
- Transactional intent
Navigational keywords
Users with a navigational intent hardly use any long tail keywords. They mostly use brand names or in some cases product names.
Informational keywords
Keywords used by common searchers to find things: it's these keywords keyword research is most often after. These keyword searches can be short tail or long tail. The intent of the search: looking for more info about something, a certain subject or product.
Transactional keywords
Transactions! These are often long tail keywords in combination with a product name and an intent of action. For example: "where to buy an iphone 5".
But wait! There's a catch. How do you decide which keyword belongs to what intent?
That's up to you to decide.
These are some rules you could follow to make live easier:
- If the product name or brand name query doesn't contain another keyword = Navigational
- If the a query contains keywords like "what, where, who, .." = Informational
- If the query contains keywords like "buy, rent, order, contact, " = Transactional
There's a thin line between those intents but you need to decide which keywords you'll bring under what category to start your next steps.
This is actually the hardest part: making up your mind.
Next? We need data
Dive straight into your statistics and export the data you need.
What do you need? Keywords and dates.
Put dimensions like medium and sources aside. You want the total picture of your data to get a good idea what keywords drive traffic to your site. You're focusing on the intent, right?
Step 1 - Build a Google Analytics custom report
To make your live easier (again) - you can download the custom report here.
Make sure you set the secondary dimension to keyword.
Set the date range to the past year & follow step 2.
Note: If you want to improve this one, you may want to consider excluding (not provided) & none.
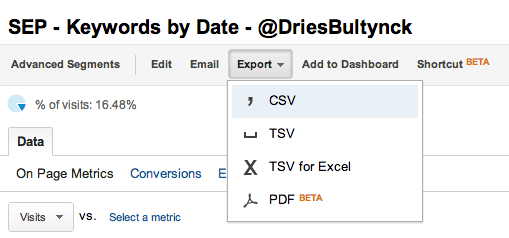
Step 2 - Export to Excel
Make sure you change 'table.rowCount%3D500' (in the url) into something more to export everything.
Google Analytics lets you only export 20K rows at a time, so this can take a little while until you get a year of data.

Note: You might consider to bucket this per month depending on the amount of keywords
Step 3 - Sort & make buckets
Transfer the exported data in columns with the "Text to columns" function in Excel.


Next? Make a column extra next to date, call it "markup date" and use this function below (Tnx to @amedee for this function) to make it a real data that Excel can read.
=DATE(MID(A2;1;4);MID(A2;5;2);MID(A2;7;2))
Note: If this function gives an error, you might copy paste the data into a non-markup text tool to get rid of any markups.
Next? Add a column next to "markup date" and call it "week of year". Use the weeknumber function to get the number of the week.
After doing that, you'll get something like this:


Next? Add a column "intent" and start giving each keyword a intent. Remember, you only have three. If you want to speed things up, use a filter on the column and select keywords in bulk that have the intent you define for each intent category.
For example, you'll get something like this:


Note: you might want to give some colour to your intent to make it easier to recognize. Colours are a great help to work faster.
Ok, lets do some fun stuff now!
Analyze & Funnel Intents
Is freshness an important signal for all sites?

Noticed where Matt said "make good content and make it relevant"?
He forgot to say: make it relevant when people are searching for it.
Get back to your excel file and start sorting by number of the week & intent.
Et voila!
You have a pretty good idea what people look for during several periods of the year and what to focus on regarding the keywords that bring traffic or leads. You'll beat Query Deserves Freshness when you need to right on the exact moment you're audience is looking for it.
This is one of the ways you could think about making a media and content marketing plan for your website.
Take it a step further: (Re)think your online (& offline) strategy
There are several things you can do with this basic data & analysis. You might want to break it up per funnel segment (intent I mean) to keep an overview. It keeps communication easy across different teams (IT, Marketing, Management) and makes it easier to set deadlines to specific actions.
I'm not going to talk about what strategies you could use, because that depends on your business. So... let me give you some extra tips to handle teams & convince your management.
Gear up your teams!
Own your strategy. That's very important. Be sure to communicate everything you need to get done by a certain team. You have the lead, make sure you keep control.
- It's not about you or them
Make it 100% crystal clear that this is about the product & the company. Work like a team. Make things happen. Make your boss proud. If he's proud, he'll will show his appreciation in one or an other way. - Again, it's not about you
Make sure your teams understand that this is not a personal thing. If something goes wrong, no one takes the blame. Fix it. With the whole team. Back each other up. - Approval is key, own it!
You need to stick by your plan and keep track of things. Get things done and check the work of each team. Make sure everything ads up. Each assignment, every detail needs to be checked to make sure everything works out as you planned. Set deadlines and review dates so both parties know what's expected to be finished on that particular day. - Be supportive no matter what
Make sure you calculate some days extra into your planning. When things not going like planned, you have some backup time. It looses the tension and stress on the team. Go talk to them, be supportive and help them out where ever you can.
Get a "GO" from the management
This sounds like a no-brainer but its often one of the hardest parts: Convince your superiors and theirs. They decide whether your approach gets a "GO". They have the power to give you the budget and time, so make sure you explain everything in a top management overview.
How to convince your management
- Keep it simple & transparent
Data must be understandable in a blink of an eye. If you need to explain graphs and data longer than 1 minute flat, you might want to think it over. - Point out the strengths of your plan
Point out grow and how the company will grow from this. Think profit but also internal education. Management loves progression on both axes. It keeps momentum high and people motivated. - Have a plan B (that is not as good as plan A - deliberately)
Sometimes, management has a different view or may not be totally convinced of your plan. If they don't like the plan, point out the key issues where the company got stuck. Be honest but also give reasonable solutions. Do not ever point out the problem without suggesting a proper and scale-able solution. If its budget, talk budget and how you can grow profit. If its time, suggest your own deadlines to get things done. - Be clear & realistic about deadlines
You don't want to rush into anything so set your deadline before they set yours. If you come up with a decent plan and deadlines set to each goal, they probably won't. - Be sure to get the budget & resources you need
Ask for enough budget. Don't ask too much, but ask a little bit more than you'll actually need. There is no option asking for more budget or more time from the specific department (IT, Marketing, ) if you come to the conclusion your estimation was too tight.
And now? Take action!
If you liked this post, you might also enjoy This Is How You Easily Setup Actionable Google Analytics Dashboards
