

On the 7th day, of the 12 Days of Content SEP gave you 7 tips on creating amazing infographics.
Text just doesn't lend itself well to some things. Numbers buried in a paragraph? Yawn. Dense statistics that read like an annual financial report? No thanks.
This isn't an Economics class, it's the internet. People bounce around searching for information in the quickest, most easily accessible manner possible. But an active mouse finger and need for instant gratification doesn't take away from the fact that people still want to find relevant, useful information, and infographics are the perfect way to present valuable data in a way that is fresh and consumable. Why include infographics in your content strategy? See below (we're so meta).
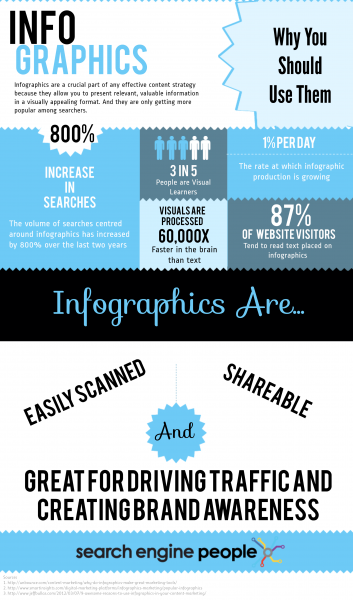
Infographic About Infographics
Infographics are a great content format that are shareable and useful, but they're not all created equal. Here are 7 tips to follow that will help you fully maximize your infographics to broaden their reach and impact.
1) Plan
You have a topic in mind. You have some bite-sized tidbits of information. You have statistics and information. Time to get started, right? Just hold on a tick. If you've ever created (or attempted to create) an infographic, you'll know that you need to have a plan. Start with the information you have and brainstorm ways that it could be visualized. Are you going to use a template? Think long and hard about what template can best capacitate your data. Designing from scratch? Break the data up into sections, just as you would with an article, eBook or some other type of content. Properly planning your infographic will save you a ton of time (I speak from personal experience).
2) Say something useful
Data visualization is a wonderful thing. But doing it just because you can is inadvisable. You have to offer some sort of value, and this is done by providing useful, relevant information. If you provide little more than an aesthetically pleasing experience with your infographics, you're doing nothing to position your brand as a thought leader and authoritative resource.
3) Be bold and creative
My grade 8 art teacher used to tell us to follow the ABCs: be Attractive, Bold and Catchy. My embarrassingly poor mark in that course notwithstanding, this little wisp of wisdom is great advice. Your infographics should be attractive and creative, without sacrificing the integrity of the data being presented. The Zombie SEO infographic in this post by RankPop is a great example.
4) Be unique
Like any other type of content, your infographics should be unique. This doesn't mean you need to find a topic that has never been covered (try doing that and let me know how it goes), but rather that you should create something that presents the information in a way that differentiates your content from everyone else.
5) Dont be too complex
Many, many infographics I've seen are guilty of being convoluted. If I wanted to be confused, I would watch a David Lynch film. Remember, the point of an infographic is to present data in a way that is easily consumable, so keep it simple.
6) Tell a story
Find a way to present information in a way that flows logically and tells a story. While people may not want to read a dense manual or report, they do want the highlights. Draw people in by presenting numbers and stats with short tidbits of text to give your infographic a story that flows and informs. You've got all the data; you just need to give it some legs.
7) Don't be self-promotional
While infographics can vary wildly, they are similar to many other types of content in the sense that they should be helpful and informative, NOT promotional. Infographics aren't advertisements -- don't try and hard-sell your audience. Be entertaining and interesting, offer insight and education, but avoid being overtly self-promotional as its sure to drive people away.
To really leverage the full potential of infographics, the above steps are necessary. They're a facet of your content strategy that is meant to attract visitors, encourage sharing and contribute to your overall content marketing efforts. Providing real value to your audience through infographics will help bolster your online branding, demonstrate expertise and drive traffic to your website.


